GP partner and QOF expert Dr Gavin Jamie explains how childhood immunisation payments are changing and explores the potential financial implications for practices
GP practices will be dealing with an entirely new system for payment of routine childhood vaccinations from April 2021.
The previous system, which applied for decades, was becoming increasingly complicated as new vaccines were added to the schedule. It involved a combination of both item of service and target based payments, and each new vaccination course seemed to use a different method.
Payments were largely based on the completion of courses of vaccinations.
The targets were based around the proportion of children who had completed the course, with an initial payment triggered at 70% completion and a larger payment triggered when 90% of children had completed the course.
The new system is complicated in its own way, although the vaccination schedule remains broadly the same.
As with any new system there will be winners and losers, but most practices should see an increase in their income from childhood vaccinations – in some cases quite a large increase.
Three separate payment components
There are essentially three separate elements to the new system. As outlined below, the effect of these changes combined is to create big jumps in payment at around 80% of vaccination uptake and, in those areas with a QOF indicator, another big jump at 90% followed by a steep increase to 95%.
Item of Service fees
The first is the relatively straightforward item of service (IoS) payment of £10.06 for each vaccination or immunisation given to a patient. Most practices will be familiar with this system as it is similar to that used for influenza or pneumococcal vaccinations. The IoS payments for the MMR vaccine began last April 2020 and practices should have seen an income boost from this.
The payment will apply equally to ‘catch up’ vaccinations in patients who have missed out on scheduled vaccines. This should encourage practices to offer appropriate vaccinations to patients regardless of age.
QOF
The second part is a set of three QOF indicators which award payments based on reaching thresholds. These will generally only apply to the highest achieving practices as they start at 90% for two of the indicators, and 87% for the third. There are quite a large number of points involved so these last few patients will carry a considerable amount of the payment available.
Clawback
Thirdly, to correct for any potential advantage to achieving low uptake due to the IoS payment, practices with uptake below 80% will forfeit IoS payments equivalent to half of the eligible population. This means that reaching 80% coverage carries a big boost to practice income. It is not clear if any practices with below 50% uptake could end up in deficit, although this scenario will hopefully be quite rare anyway.
It is also not yet clear how the eligible population will be defined, which is critical for the calculation of the 80% threshold and the forfeit.
QOF indicators and value
Looking at the QOF component in more detail, the three indicators reward high uptake of key immunisations as follows.
1. Completion of DTaP vaccinations at eight months old
The first indicator applies to children on the day that they turn eight months old. At that time, they should have received three doses of the diphtheria, tetanus and pertussis (DTaP) combined vaccines – in line with the national schedule. Practices gain three points for getting to 90%, rising to 18 points for 95%.
That is a lot of points over a small range. For most practices, this will mean between two and four points for each additional patient they vaccinate within this range – equivalent to more than £500 per completed course for patients that take you from 90-95% of achievement.
Previously, most of the additional income came with the single patient that took practices over the 90% barrier, although it’s important to note that this new QOF indicator is not an exact equivalent of the old incentive, which looked at the full range of completed vaccines and at two years old.
Of note, practices will not be able to exception report (or, in new jargon, apply ‘personalised care adjustment’) other than for rare cases where the vaccination is contraindicated. This could include an allergy to the vaccine. The lack of exception reporting options is unusual in QOF.
Full indicator: The percentage of babies who reached 8 months old in the preceding 12 months, who have received at least 3 doses of a diphtheria, tetanus and pertussis containing vaccine before the age of 8 months (Points:18; Threshold: 90-95%; Points at lower threshold: 3)
2. Uptake of first MMR dose at 12-18 months
The second indicator is similar, this time looking at the first measles, mumps and rubella (MMR) vaccination between 12 and 18 months. There are seven points for getting to 90% and 18 at 95%. This is worth the same amount of money but applies to a single vaccination rather than the three doses of the previous indicator.
Once again there is a tight timescale to give the vaccination and there is no exception reporting allowed unless there is a contraindication to the vaccine. This could include an allergy to the vaccine or, in the case of MMR, an immune disorder precluding the use of live vaccines.
Full indicator: The percentage of children who reached 18 months old in the preceding 12 months, who have received at least 1 dose of MMR between the ages of 12 and 18 months (Points: 18; Threshold: 90-95%; Points at lower threshold: 7)
3. Completion of DTaP booster and both MMR doses by five years
The third indicator follows the same pattern. The vaccinations this time are both of the MMR doses and a booster of the DTP vaccination, with uptake measured at five years old.
As the national schedule recommends these at three years four months old, it could be two or three years before a completed course appears in a practice’s QOF figures. So this year much of the payment for this indicator will be for immunisations that happened between summer 2019 and summer 2020. (There was a delay under the old system as one payment measuring completed vaccinations at five years.)
There are another 18 points available again, but over a slightly wider range than in the other indicators. There are seven points for achieving 87% coverage with full points for 95%.
As above, no exception reporting is permitted other than for a contraindication to the vaccines.
Full indicator: The percentage of children who reached 5 years old in the preceding 12 months, who have received a reinforcing dose of DTaP/IPV and at least 2 doses of MMR between the ages of 1 and 5 years. (Points: 18; Threshold: 87-95%; Points at lower threshold: 7)
How will this affect practices’ income?
There will be winners and losers whenever changes are made to a payment system.
In this case, we don’t have all the necessary parameters to model exactly how the new payment system will reward practices compared with the old, but we can make some predictions based on what we know.
How payments change at different thresholds
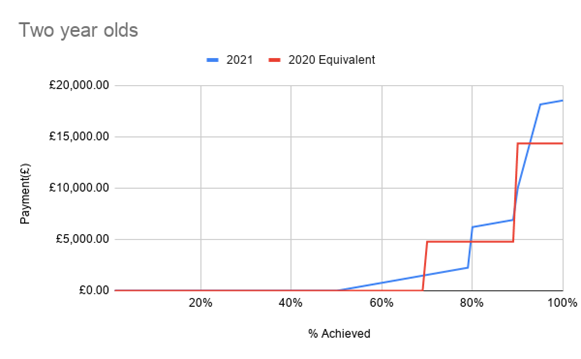
Some of the changes are tied to the movement of the thresholds. Practices that were meeting the 70% threshold of the older system but missing the 80% of the newer system are likely to see losses. Similarly, practices that were just over the 90% level but are not at the upper end of the QOF indicator range may see a drop in income.
The below chart attempts to illustrate this, showing how payments rise with increasing vaccination uptake in two-year-olds, using the old (red) payment versus new (blue) payment system. It’s important to emphasise that this is an imprecise estimate, based on my own practice list and assuming the same uptake of DTaP and MMR, as measured by the new QOF system, as of DTaP, MMR and Men C at two years.
Modelling the impact on practices
We can use the most recently published immunisation uptake data from 2018/19 to create a model of how the changes might impact on practices. (Please see details of how the calculations were made below)*. Again, this is only an estimate, not least because the old system worked quarterly and the new one is an annual calculation so it is impossible to be 100% precise at the practice level.
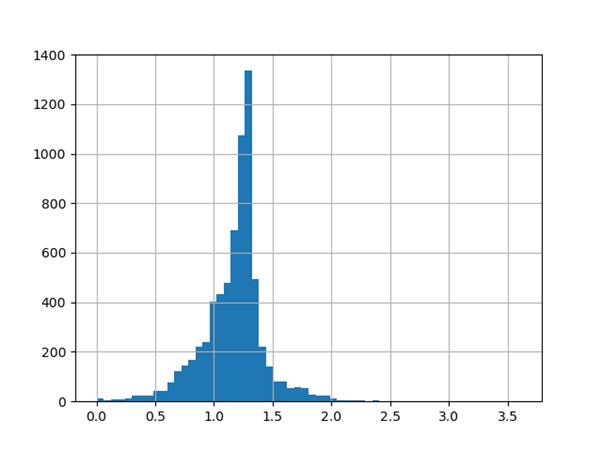
Overall, the new scheme appears to be good for practices, with an average increase of about 17% in childhood vaccination funding over the two years. There is a wide variation, however, and around 20% of practices will see a drop in income, while a typical practice can expect around a 20% increase and a very small number look set to more than double their income.
The chart below shows the projected change in income this year compared with 2019/20 (assuming similar uptake). Note that the projected figures compared with 2020/21 will be around 7–10% (0.07–0.1 on the chart) lower due to the MMR IoS payment being brought in last year.
What does this mean for individual practices?
We can do some further modelling selecting three practices of similar size, with a 12-month old cohort of 70, and a range of vaccination uptake – practice A with low uptake of all the routine childhood immunisations, B with fairly typical uptake and C with high uptake across the board – as detailed in Table 1.
Table 1: Example practices vaccine uptake – %
| DTaP IPV 5y | DTaP IPV Hib 12m | DTaP IPV Hib 24m | DTaP IPV Hib 5y | Hib MenC 24m | Hib MenC 5y | MMR1 24m | MMR1 5y | MMR2 5y | Men B 12 m | PCV 12m | PCV 24m | Rota 12m | ||
| A | 49.2 | 75.7 | 86.9 | 76.2 | 68.9 | 74.6 | 70.5 | 77.8 | 68.3 | 75.7 | 77.1 | 67.2 | 74.3 | |
| B | 87.6 | 94.3 | 91.8 | 95.9 | 90.4 | 89.0 | 90.4 | 94.5 | 84.9 | 95.7 | 95.7 | 90.4 | 95.7 | |
| C | 94.5 | 97.1 | 100.0 | 98.6 | 97.8 | 98.6 | 97.8 | 98.6 | 94.5 | 97.1 | 97.1 | 97.8 | 94.3 | |
The projected payments for each practice based on their uptake are set out in Table 2. We can see Practice A is hit hard by the move to measuring at 8 months, rather than 2 years, for the DTaP vaccinations, and as a result of being below 80% for a lot of the other indicators. By contract, Practice C achieves top QOF points and sees a sizeable increase income.
Table 2: Example practices payments
| 5 year old – old payment | 5 year old – new payment | 2 year old – old payment | 2 year old – new payment | New/Old payment | |
| Practice A | £0.00 | £115.69 | £4,084.93 | £1,661.62 | 0.44 |
| Practice B | £1,126.81 | £1,267.56 | £10,581.91 | £11,964.75 | 1.13 |
| Practice C | £3,380.55 | £5,009.67 | £6,721.17 | £8,585.47 | 1.35 |
While it is difficult to make any confident predictions based on the various models, the findings suggest the following:
- The effort to get to the QOF targets is reasonably well rewarded once you are on that slope.
- For practices with uptake of around 90% there is a strong incentive to strive to achieve 95%. For practices with achievement in the low 80%s there is less of an incentive.
- By contrast, for practices in the high 70%s there is a big incentive to push over 80%.
For practices that currently have low uptake it suggests they could lose out unless they can achieve significant increases in uptake.
This raises concerns, given we know vaccine reluctance may be higher in areas of deprivation and with populations with greater ethnic diversity. We have seen this with Covid vaccination.
How can practices look to improve their performance?
Looking at the practical steps that practices can take to improve uptake and thereby financial performance, the usual measures apply such as:
- Informing pregnant patients about vaccinations their children will need
- Reminding mothers when they attend for postnatal checks or other appointments
- Sending congratulations cards to new parents with information about your baby clinic and appointment dates and times
- Advertising the service on the website and via waiting room noticeboards.
This year it will also be important for practices to be looking at their data recording for vaccinations. It is important that vaccinations that occurred elsewhere, perhaps before the patient was registered with the practice, are accurately entered in the notes.
Calling patients in for vaccinations in a timely manner is going to be particularly important to meeting these targets. Contact with a clinician by telephone may be worthwhile, as we are seeing with approaches to help Covid vaccination uptake.
Dr Gavin Jamie is a GP partner in Swindon and runs the QOF Database website
*How calculations were made
Immunisation uptake data were taken from NHS Digital database for 2018/19.
Calculations for the old system are based on the SFE explained in the full version on page 43. The current schedule lists the six injections. Rotavirus was paid separately under the old Childhood Immunisation formulae, so is not included.
To project payments under the new system, the calculation of total income from IoS fees is based on the uptake data for each vaccination course in 2018/19.
Regarding the QOF element, projected calculations for the first two indicators, measuring uptake of DTaP at 8 months and MMR at 12-18 months, are based on the published uptake data of DTaP/IPV/Hib at 12 and 24 months.
For the third QOF indicator (DTaP booster and both MMR doses at five years), this is based on uptake data for DTaP/IPV/Hib at five years and the second MMR dose at five years.
Key assumptions/limitations:
- Using annual rather than quarterly data will only be an approximation only for the old target thresholds
- Where there are multiple vaccinations in one course, the minimum achievement for any of the vaccines is used. This is likely a small overestimate
- It is assumed that the 80% threshold for full IoS payment applies to each vaccination course individually
- The QOF point value is for 2020/21 but the cohorts are for 2018/19. This is likely to artificially increase the value by a few percent.
To calculate the clawback at 80% I have also assumed that each course is based on a single year group. It is not really clear what the denominator is here. A mechanism was promised in the contract upatedetails for 2020/21 but this did not actually appear when the SFE amendments were issued.
A Note on the MMR IoS payment
This was introduced already, in 2020/21. Therefore, the change in your income will depend on your base year.
A full breakdown of the workings can be viewed here.
This article was initially published on our sister site Pulse Intelligence. View more Pulse Intelligence articles here.


